Author: Jie Wei
-
Investigating week 3
I called my research method speculative project. I sent the stain graphics extracted from the same seat to different people, asked them to guess what it was, and describe their guesses, and then asked them to send a picture of the object they thought of the shape of this object might appear. Photos in the space scene, the photos sent to me by people are considered to be a randomly projected personal experience. Then I edited the photos sent to me and typeset the stained shapes I extracted before into an experimental book. The purpose of this is to record how the stain from a specific space will be randomly projected into what kind of space, and sort out the results of the research into readable and understandable books.
In this experimental reading, I did not first explain the background of my project, but first showed the shape of the stains and invited readers to guess what these stains were, so that readers could experience the process of projecting subjective imagination of unknown graphics, and finally explained that these stains actually came from the seats of the northern line.
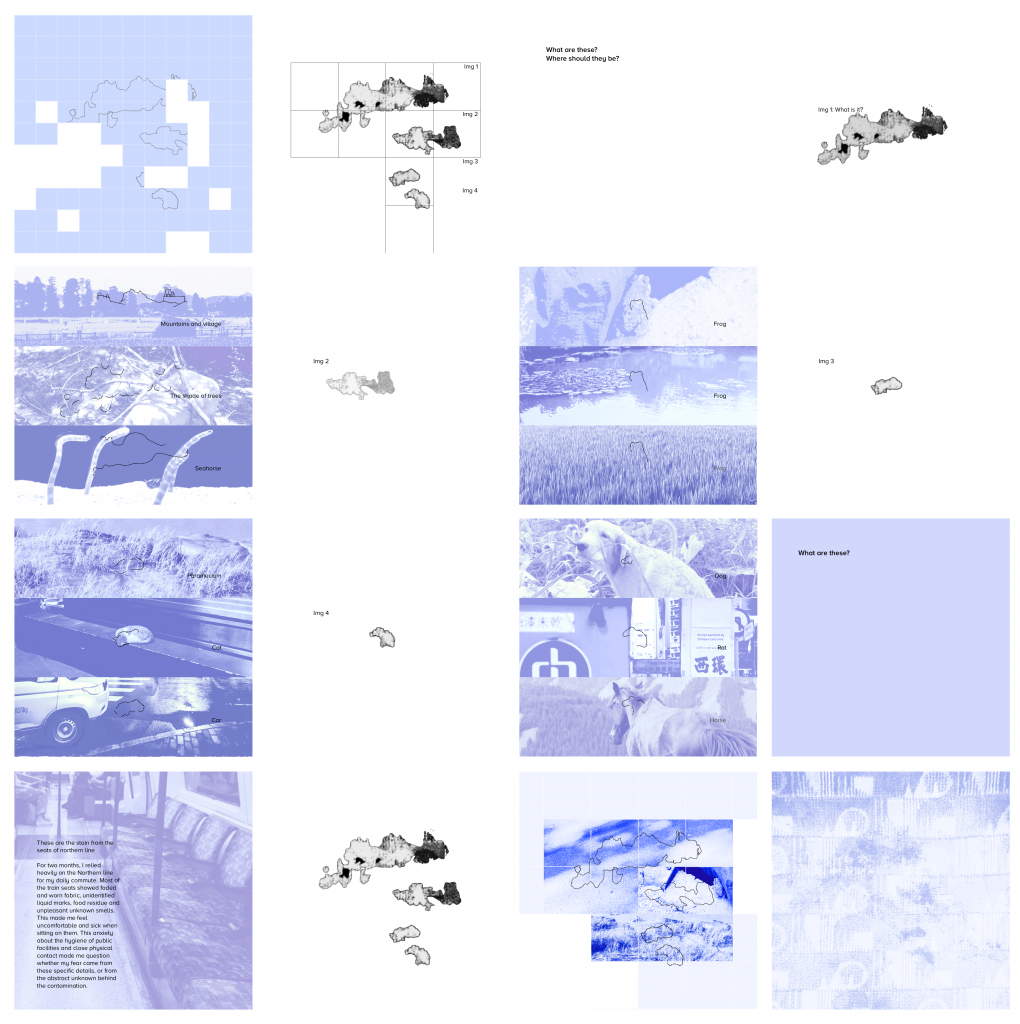
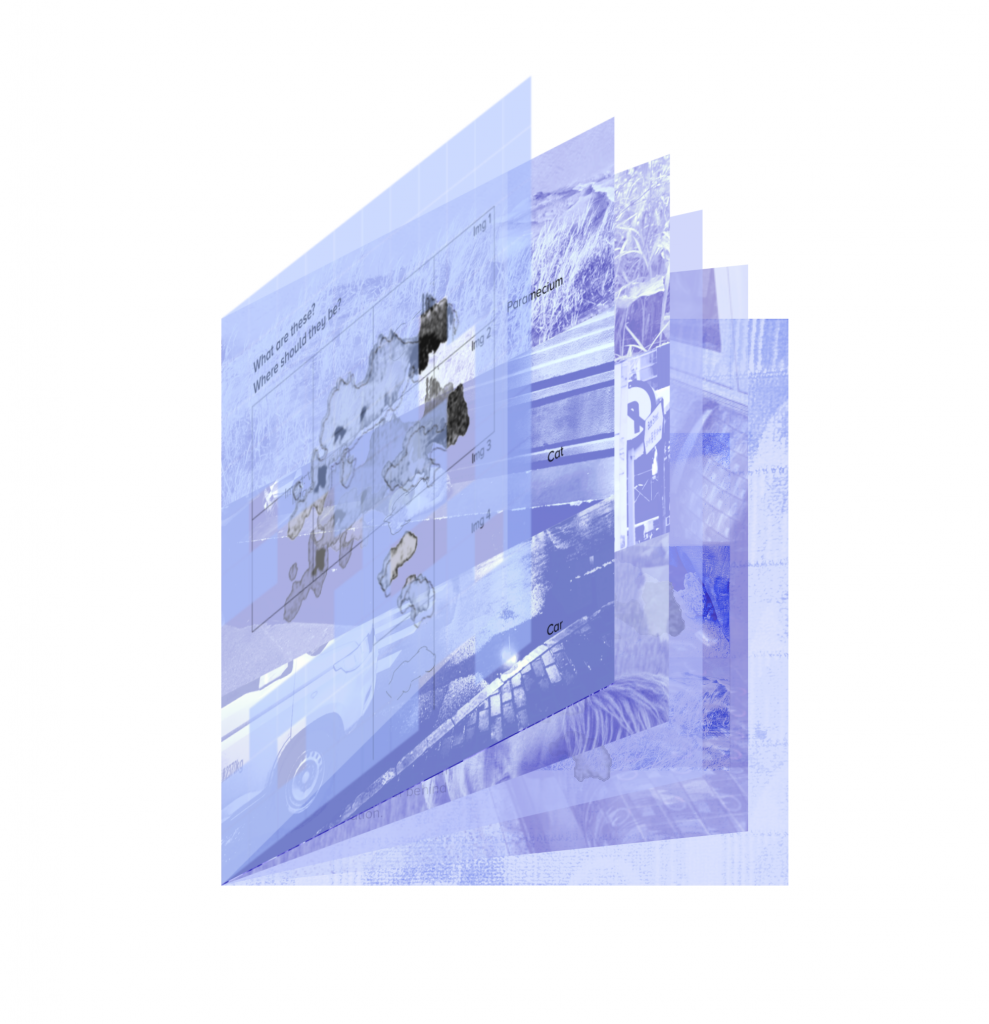
In terms of typesetting and printing materials, I choose to print the whole booklet with sulfuric acid paper. I want to use the transparency of acid paper to make the subjective projection from the shape of the stain to the scene clearer and can be read for understanding.
-
Investigating week 2
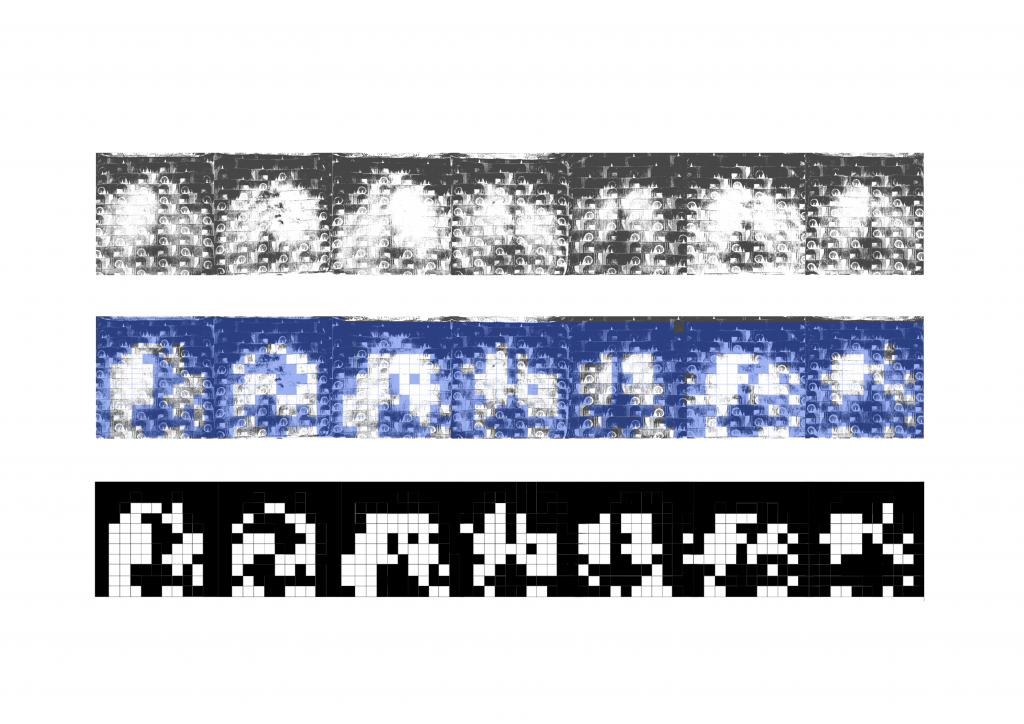
Furthermore, I tried to carry out two visual experiments. First, I found that the fabric on the surface of the seat looked like a grid pattern stitched together by squares. I tried to establish a grid system to understand the distribution of stains on the surface of the seat, and fill in the color in the area where the stains appear in the seat to the grid system. I finally got an abstract grid graphic that can present the pattern of stain distribution on the grid scale. I think this is an attempt to visualize the distribution law of stains.
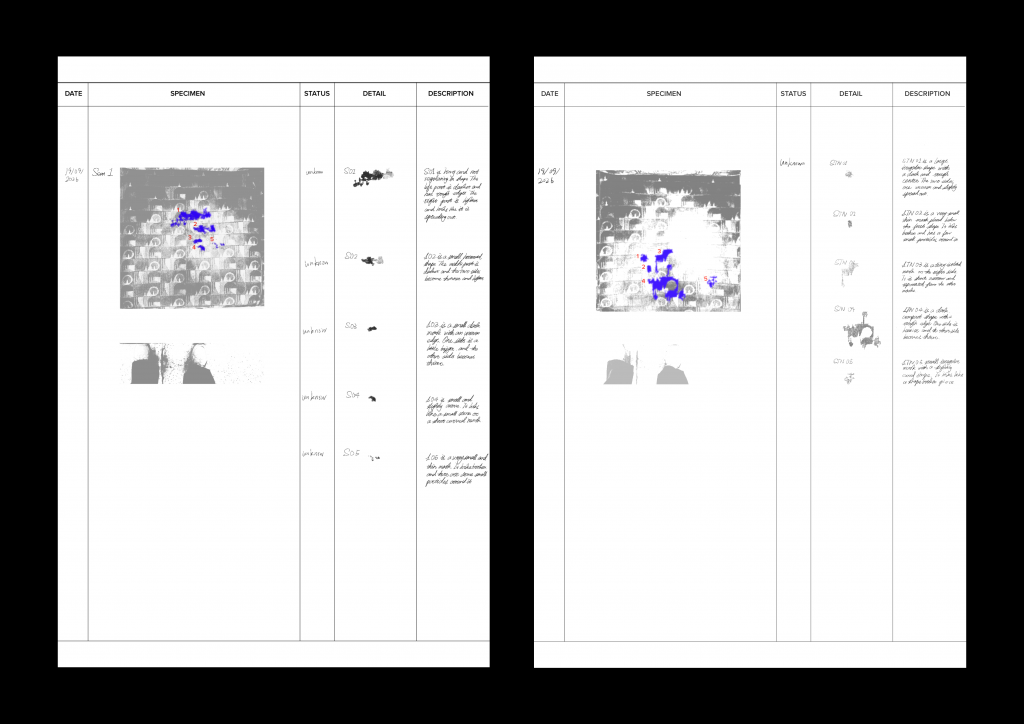
Second, I used Photoshop to remove these stains from the seat and replace them with solid color blocks with the same shape as the edge of the stain. Then I described the four separately deducted shapes, and finally typed these contents into files to record the information. In the second experiment, I realized that when these stains were separated from the environment and observed as individuals, my subjective nausea was weakened, which inspired me to study the relationship between emotional projection and objective graphics.
-
Investigating week 1
Site: The seat of 527 II carrige of Northern Line.
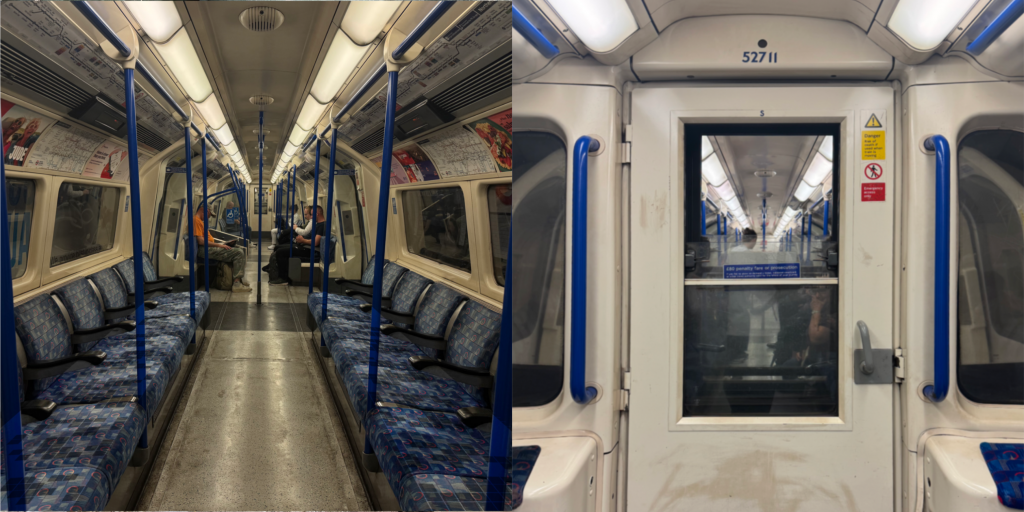
I used to travel by northern line every day for two months and the seats covered with unknown stains on the northern line made me feel uncomfortable. From this experience, I want to take the seats of the northern line as a research object and explore how to study this feeling in the way of graphic communication.
My research site was the seats of the northern line 527 II carriiage. I focused on the pollution of the seats and I scanned the 7 seats on the carriage with my mobile phone into pictures.
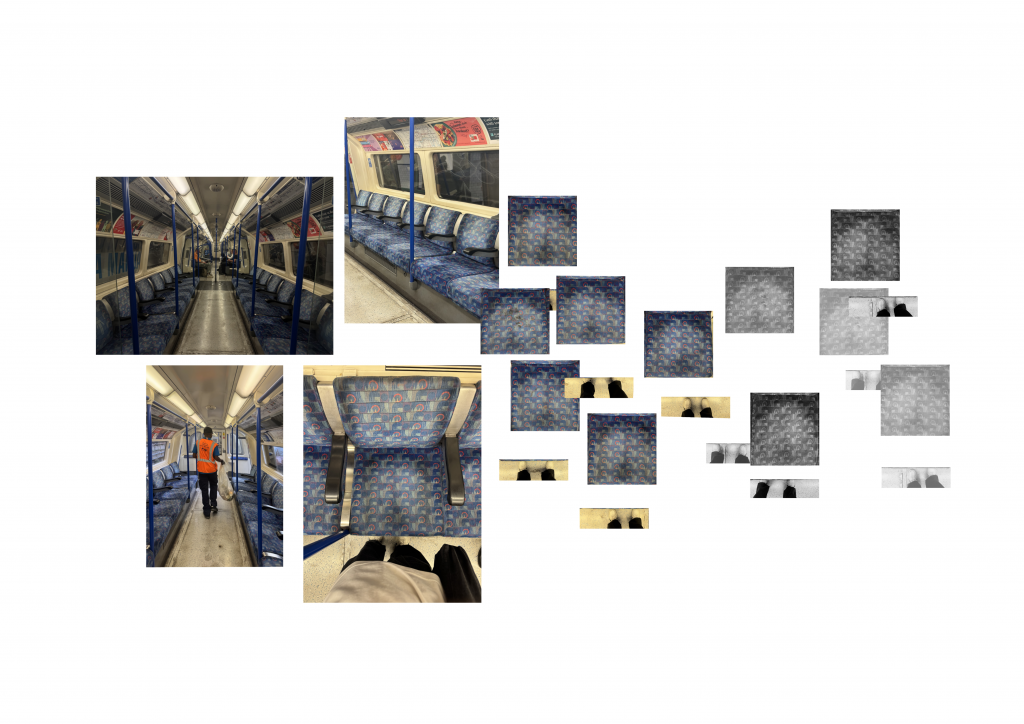
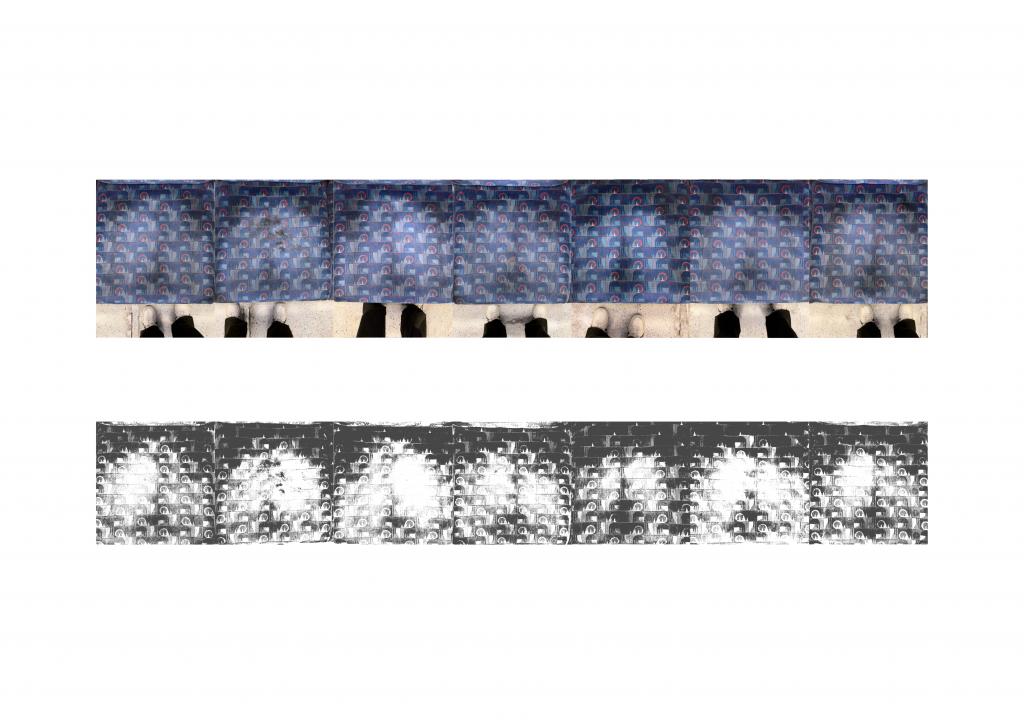
Later, I imported these pictures into photoshop to increase the contrast and summarized some observed stain distribution patterns. The gap between the back half of the seat and the passenger’s body is a large area of contamination. Due to the concentrated appearance of stains, the color is darker than the first half, and the shape of the stain is more difficult to distinguish. The first half of the area where there is contact with passengers when they sit down is generally unknown stains that appear randomly. The fabric fades due to friction, and the shape of the stains in the first half is easier to observe and extract completely.
-
Investigating written response
The influence of Georges Perec’s Species of Spaces and Other Pieces is mainly reflected in my process. Perec encourages observers to slow down and record ordinary details that are usually ignored. He asks us to write down “what is of no interest, what is most obvious, most common, most colourless” (Perec, 1999, p. 50). This made me rethink my way of observing. At first, I only thought that the Northern line seats were dirty. However, after photographing and scanning them repeatedly, I began to pay attention to the location, edges, colour, fabric fading and repeated appearance of the stains on different seats. As a result, my research changed from an overall emotional response into a systematic record of the seat surface. Perec’s approach made me realise that observation is not passive. It is a process of learning how to see a familiar space through repetition, classification and recording.
I take the seats in a Northern line carriage as my research subject. Because I used to ride the Northern line every day for two consecutive months, the unknown stains and signs of wear on the seats made me feel uncomfortable. I recorded these traces through photography, scanning and visual tracing, and extracted the stains from their original context to study whether viewers’ feelings and understanding would change when they became independent graphic forms.
Agnès Varda’s film The Gleaners and I relates to my project mainly through its theme. Varda focuses on discarded and overlooked objects and materials, bringing them into view through collecting and re-presenting them (Varda, 2000). This encouraged me to pay attention to the stains on the Northern line seats. They are usually regarded only as sources of pollution and discomfort, rather than as traces with particular forms and research value.
This led me to ask why stains create discomfort, and whether something is lost when they are removed from their original environment. After being extracted from the seat, a stain loses its original hygiene context. It becomes an unidentified shape that can be imagined as an animal, object or space. Varda therefore helped me consider how an overlooked thing can be understood differently when it is placed in a new context.
Finally, I used tracing paper to make an experimental publication. The transparent pages allow the stain graphics, participants’ imaginations and the original seat images to overlap. This shows that when a stain is separated from its original environment, the feeling of disgust can become weaker, while new personal interpretations appear. My project therefore does not only record that the seats are dirty. It investigates how a physical trace gains new meaning through visual transformation and viewer projection.
Reference List
Perec, G. (1999) ‘The Street’, in Species of Spaces and Other Pieces. Edited and translated by John Sturrock. London: Penguin, pp. 46–56.
Varda, A. (2000) The Gleaners and I [Film]. Paris: Ciné Tamaris.
-
Written Response
I chose to copy Clement Valla’s Postcards from Google Earth project. In this project, Clement Valla recorded Google Earth through screenshots: bridges that melt into the river below, highways that drape over hillsides like fabric, and terrain that folds in on itself. He argues that these are not glitches in the sense of errors. They are the direct result of how the system works. The images are not manipulated. They are screenshots. What they record is an automated system doing exactly what it was designed to do and producing pictures nobody intended (Valla, n.d.).
When I tried to find the same views in Google Earth in 2026, some of the distorted forms had changed. This made me notice that a screenshot can keep a version of an image that I can no longer capture in the same way.
I used the Conditional Design Manifesto to guide my iteration: for each place, I collected Google Earth screenshots from different years and paired them with Google Maps reviews from those years. Repeating the same rule across different places let me compare the results and notice things I had not planned in advance (Maurer et al., 2013).
At first, I worked at the image level to show a sense of temporal dislocation within the same space by collaging screenshots from different periods of the same place. After visual testing, I made an interesting discovery about the shape of the bridge, squeezed along the shape of the mountain by the system, is very similar to the shadow of the bridge on the mountain after the system update. I tried to take two screenshots of the same bridge from the old and new systems and stitch them together, so that the collapsed bridge from the old system and the shadow of the bridge from the new system were connected, implying that the shadow of the new bridge was a visual extension of the form of the old bridge. However, although this effect produced interesting psychological suggestions, it was weak in terms of studying how screenshot can reflect a history that has taken place.
So I tried to use screenshots as a medium to reflect history on more levels. These attempts included trying more complex visual effects, making more irregular image changes, and finding new information as a visual element before turning the image into a postcard. Because screenshots can record information, I began to ask whether a screenshot could also reveal the history of the image it records.
I noticed the review content on Google Maps while searching for material. Maybe this is simply because Google Earth and Google Maps were originally developed for related purposes. I wanted to explore what kind of historical information Google Maps carried. I entered the addresses connected to the Google Earth images into Google Maps. Afterwards, I browsed the reviews of these addresses. Through reading them, I learned many details about these places—for example, that gold could be mined in one of the parks, that a bridge was very difficult to cross by bicycle, and that a car on the bridge had been hit by stones. These reviews seemed like information about these addresses passed on by strangers. By reading the reviews, I developed a concrete impression of the abstract images of places I knew nothing about. As records stored by the platform, these reviews can reflect certain events that have taken place. I tried to collect reviews posted in different years for one place and pair them with Google Earth historical images labelled with the same years. I repeated this process for different places to see what happened when the images and reviews were read together. The year a review was posted and the year of an image do not necessarily refer to the same moment, so I do not treat a review as proof of what appears in the image. (I tried to collect the annual reviews of one address and superimpose them with Google Earth screenshots from different years at that address, so that the image not only included the history of abstract visual changes, but also specific linguistic descriptions of events.)
When screenshots are used as a medium, how can I make them reflect a history that has taken place? I want the image captured in a screenshot to reflect certain histories while also carrying and transmitting those histories.
Reference List
Maurer, L., Paulus, E., Puckey, J. and Wouters, R. (2013) Conditional Design Workbook. Amsterdam: Valiz.
Valla, C. (n.d.) Postcards from Google Earth. Available at: https://clementvalla.com/work/postcards-from-google-earth.html (Accessed: 3 November 2026).
-
Hello world!
Welcome to myblog.arts. This is your first post. Edit or delete it, then start blogging!